finance

Simple Python Script to retrieve all stocks data from Google Finance Screener (Part 2)

Upgraded version from previous “Simple Python Script to retrieve all stocks data from Google Finance Screener“. The new version allows options to select the various stocks exchange including all US exchange and expand on the financial metrics present.

To run the script, you can simply run the following commands.

from google_screener_data_extract import GoogleStockDataExtract

hh = GoogleStockDataExtract()
hh.target_exchange = 'NASDAQ' #SGX, NYSE, NYSEMKT
hh.retrieve_all_stock_data()
hh.result_google_ext_df.to_csv(r'c:\data\temp.csv', index =False) #save filename

The new script allows easy installation via pip. To install:
pip install google_screener_data_extract

The script is also available in GitHub.

Advertisement

Retrieving historical financial data from MorningStar Using Python

Retrieving historical financial data from MorningStar Using PythonMorning star website contains all the historical financial data such as Net income, EPS (earning per share) per year over 10 years for each stocks. It also provides the historical valuation data such as historical P/E and P/B which are quite difficult to source for. The purpose of the following script is to retrieve the historical data of all desired stocks in a format that is easily represented in Tableau for interactive representation. Below stock information are only catered for Singapore stocks but can be easily changed to other regions as will be shown below.

The first part is to retrieve the company historical financial stats. MorningStar website provides an option to download the data in excel or CSV format. Retrieving in csv format allows easy cleaning and subsequent formatting of the data. To obtain the url for the excel downloading, use any browser and open the developer tab. The network tab will display the url for the excel after pressing on the excel/csv download button. The url will be as below format. Note the region (in blue) can be changed for stocks in another region.

http://financials.morningstar.com/ajax/exportKR2CSV.html?&callback=?&t=XSES:STOCKSYMBOL&region=sgp&culture=en-US&cur=&order=asc

To download and process the information, two major modules are required: python pattern and Python Pandas. Python pattern to handle most of the HTML calls and requests while Pandas to handle the data cleaning and formatting.

For the first part of data extraction, the downloading will be in csv format and using pandas to read the csv. A couple of things to take notes for pulling the data for the first set.

  1. Due to the different line formats, some of the lines are skipped when using pandas to read from csv.
  2. Revenue, income and dividend may be in native currencies for different stocks hence giving rise to different column names (Column names will have the currency displayed). For each of the different currencies, remove the currencies label and consolidate all under same column and extra column for the currency values.
  3. The excel default to two decimal places. Extra calculation are needed to get the actual values without rounding off.

For the second part of retrieving the historical valuation, the method of getting the table will be different as there is no default csv file to be download. In this case, will have to make use of the pandas io html table read function. This pandas method will convert any table like object (html tag td, tr) in website to DataFrame. Some processing is required when pulling this table as it is not a conventional table format. It requires ignoring some lines, renaming the columns and transposing the table.

pandas.io.html.read_html(url_html, tupleize_cols = True,header=0 )

The process is looped over the various stocks hence the full range of stocks can be retrieved. In addition, the information can be combined with the SG company stock information such as industries etc. Information on how to retrieve the SG company stock information such as current price, current valuation etc are available in the following post “Retrieving stock news and Ex-date from SGX using python”.

The full data can be displayed in Tableau as shown bleow. You can also view the interactive mode (WordPress does not allow interactive mode) in my other blog. The script are available  in GitHub.

blogview


Retrieving short sell qty for SG stocks from SGX using python

SGX usually releases short sell information for each stock at the end of each trading day. This information are found in their website. The daily short sell of all stocks are compiled into a  report classified by day. We are interested in getting the short qty ranked by stocks per day.

If we examine the link, each report is in the form of a table format. To extract the information, we can use python pattern for web content download and Pandas for table extraction. Pandas has a function “pandas.io.html.read_html” that can retrieve table like data from the html string easily.

The following lists the steps to retrieve the short sell information.

  1. URL formation: As the link are joined by the date, need to retrieve the date str to join to the fixed url string. However, not all the date will be present, eg , during weekends. A better way is keep looping the the date back from current to get the latest date avaliable.
  2. HTML data download: This can be done using python pattern.
  3. Converting the table to data frame: This can be done using Pandas function “pandas.io.html.read_html”. Also Pandas provides a rank function so that the results can be ranked accordingly. Converting into Pandas database make it easy.
  4. Ranking by absolute qty may tend to mislead as it will also depends on the shares relative volume. Combining with the actual shares traded will give  a more representative data. For this case, the data frame retrieved can be joined to the current price df created from the previous post “Retrieving stock news and Ex-date from SGX using python“.
  5. The last will be to set the alerts which can be done easily using PushBullet as describe as the following post “Sending alerts to iphone or Android phone using python“. You can customize to send the alert at the end of each trading day to determine the top 10 short sell stocks.

Below show the short sell info retrieval portion of the code found in the  “SGX_stock_announcement_extract.py”  for retrieving the short sell qty for each stocks. The updated code is found in Github.


    def retrieve_shortsell_info(self):
        """ Retrieve the shortsell information.
            will form the url and retrieved the information using pandas to make into table.
            The function will set to self_shortsell_info_df.
            make it iterat over the days to get the latest data
        """
        for last_effective_date in range(7):
            self.form_shortsell_url(last_effective_date)
            url = URL(self.shortsell_full_url)
            try:
                #see data is available for that current date
                url_data = url.download(timeout = 50)
                shortsell_list = pandas.io.html.read_html(url_data)
                self.shortsell_info_df =shortsell_list[1]
            except:
                continue

            #continue if there is no data
            if len(self.shortsell_info_df) == 0: continue

            self.shortsell_info_df.rename(columns={0:'Security',1:'Short Sale Volume',
                                                  2:'Currency',3:'Short Sale Value',
                                                    },inplace =True)
            self.shortsell_info_df = self.shortsell_info_df[1:-3]
            #change type of the columns
            self.shortsell_info_df[['Short Sale Volume', 'Short Sale Value']] = self.shortsell_info_df[['Short Sale Volume', 'Short Sale Value']].astype(float)
            #need a rank on the short sell
            self.shortsell_info_df['ranked_shortsell'] = self.shortsell_info_df['Short Sale Volume'].rank(method='min',ascending=False)
            self.shortsell_info_df['shortsell_lastdate'] = self.set_last_desired_date(last_effective_date)
            #need percentage as well

            # have a sorting of data?
            return

        print 'No suitable data found within time frame.'
        return

    def form_shortsell_url(self, last_effective_date):
        """ Based on the current date to set the shorsell url.
            Set to self.shortsell_full_url
            Args:
                last_effective_date (int): last desired date in yyyymmdd.
        """
        #retrieve the current date in yyyymmdd format
        self.shortsell_date_url = self.set_last_desired_date(num_days = last_effective_date)
        self.shortsell_full_url = self.shortsell_info_start_url + self.shortsell_date_url + self.shortsell_end_url

    def set_last_desired_date(self, num_days = 0):
        """ Return the last date in which the results will be displayed.
            It is set to be the current date - num of days as set by users.
            Affect only self.print_feeds function.
            Kwargs:
                num_days (int): num of days prior to the current date.
                Setting to 0 will only retrieve the current date
            Returns:
                (int): datekey as yyyyymmdd.
        """
        last_eff_date_list = list((datetime.date.today() - datetime.timedelta(num_days)).timetuple()[0:3])

        if len(str(last_eff_date_list[1])) == 1:
            last_eff_date_list[1] = '0' + str(last_eff_date_list[1])

        if len(str(last_eff_date_list[2])) == 1:
            last_eff_date_list[2] = '0' + str(last_eff_date_list[2])

        return str(last_eff_date_list[0]) + str(last_eff_date_list[1]) + str(last_eff_date_list[2])

    def shortsell_notification(self):
        """ Use for alerts on shortsell information.
            Identify top ten short sell plus target stock short sell information.

        """
        ## get the current price df so can combined with the shortsell info
        self.process_all_data()
        merged_shortsell_df = pandas.merge(self.shortsell_info_df,self.sgx_curr_price_df,left_on = 'Security', right_on = 'CompanyName' )

        ## add in additional columns
        merged_shortsell_df['shortsell_vol_per'] = merged_shortsell_df['Short Sale Volume']/merged_shortsell_df['DailyVolume']
        merged_shortsell_df['ranked_percent_vol_shortsell'] = merged_shortsell_df['shortsell_vol_per'].rank(method='min',ascending=False)

        top_shortsell_df = merged_shortsell_df[merged_shortsell_df['ranked_shortsell'].isin(range(1,16))]
        top_shortsell_df  = top_shortsell_df.sort(columns = 'ranked_shortsell', ascending =True)
        top_shortsell_df = top_shortsell_df[['Security','Short Sale Volume','shortsell_lastdate']]
        shortsell_top15_shtver = top_shortsell_df.to_string()

        api_key_path = r'C:\Users\356039\Desktop\running bat\pushbullet_api\key.txt'
        with open(api_key_path,'r') as f:
            apiKey = f.read()

        p = PushBullet(apiKey)

        if shortsell_top15_shtver:
            p.pushNote('all', 'Shortsell top10', shortsell_top15_shtver,recipient_type="random1")

        ## display for target watchlist
        tar_watchlist_shortsell_df = merged_shortsell_df[merged_shortsell_df['Security'].isin(self.companyname_watchlist)]
        tar_watchlist_shortsell_df = tar_watchlist_shortsell_df[['Security','Short Sale Volume','ranked_shortsell','shortsell_vol_per','ranked_percent_vol_shortsell']]
        tar_watchlist_shortsell_df =tar_watchlist_shortsell_df[tar_watchlist_shortsell_df['ranked_shortsell'].isin(range(1,100))]
        tar_watchlist_shortsell_df  = tar_watchlist_shortsell_df.sort(columns = 'ranked_shortsell', ascending =True)
        tar_watchlist_shortsell_shtver = tar_watchlist_shortsell_df.to_string()

        if tar_watchlist_shortsell_shtver:
            p.pushNote('all', 'Shortsell targetwatchlist', tar_watchlist_shortsell_shtver,recipient_type="random1")

Sample output as followed:
Security | Short Sale Volume|  ranked_shortsell | shortsell_vol_per | ranked_percent_vol_shortsell
Sembcorp Ind | 3529600 | 6 | 0.437422 | 4
CapitaLand | 3313300 | 7 | 0.354216|  7
SingTel | 2809000 | 8 | 0.276471 | 16
Lippo Malls Tr | 2073800 | 11 | 0.492531 | 2

  1. Ranked_shortsell –> rank according to the absolute volume
  2. Shortsell_vol_per –> short sell qty as ratio of transacted vol
  3. ranked_percent_vol_shortsell –> rank according to Shortsell_vol_per


Python Integrated Stock data Retrieval and Stock Filter

This post aims to summarize all the works described in previous posts and shows a consolidated python module that can retrieve multiple stock data sets and act as a simple stock filter. The flowchart below shows the full steps taken to run a filter. If using the alternative time-saving approach as show in the flow chart, the time to scan through around 500 stocks would take less than 15 min. It can generate different series of filtered stocks depending on the list of criteria files created and can be scheduled to run each day prior to the market opening.

Python Integrated Stock retrieval and filter

The list below described how individual scripts are created at each posts.

  1. Getting most recent prices and stock info from Yahoo API: “Extracting stocks info from yahoo finance using python (Updates)”
  2. Criteria filtering: “Filter stocks data using python”
  3. Historical data/dividend several alternatives:
    1. Scraping from Yahoo API: “Getting historical stock quotes and dividend Info using python”.
    2. Scraping using YQL: “Get historical stock prices using Yahoo Query Language (YQL) and Python”.
    3. Retrieve from database: “Storing and Retrieving Stock data from SQLite database”.
  4. Company info and company financial data several alternatives:
    1. Direct scraping: “Direct Scraping Stock Data from Yahoo Finance”
    2. Scraping using YQL:“Scraping Company info using Yahoo Query Language (YQL) and Python”.
  5. Web scraping for stock tech analysis. “Basic Stock Technical Analysis with python”.

Below shows a sample run with a few sets of criteria. The qty left after each filtered parameters are displayed. Finally the results sample from one of the run, the “strict” criteria, are shown. Note that the filtered results depends on the accuracy and also whether the particular parameter is present in Yahoo database.

The combined run script is Stock_Combine_info_gathering.py and it is avaliable with rest of the modules at the GitHub.

 List of filter for the criteria: lowprice
—————————————-
NumYearPayin4Yr > 3
PERATIO > 4
Qtrly Earnings Growth (yoy) > 0
PERATIO < 15
Pre3rdYear_avg greater OPEN 0 # means current  price lower than 3yr ago

Processing each filter…
—————————————-
Current Screen criteria: Greater NumYearPayin4Yr
Modified_df qty: 142
Current Screen criteria: Greater PERATIO
Modified_df qty: 110
Current Screen criteria: Less PERATIO
Modified_df qty: 66
Current Screen criteria: Compare Pre3rdYear_avg,OPEN
Modified_df qty: 19

END

List of filter for the criteria: highdivdend
—————————————-
NumYearPayin4Yr > 3
LeveredFreeCashFlow > -1
TRAILINGANNUALDIVIDENDYIELDINPERCENT > 5
PRICEBOOK < 1.5
TrailingAnnualDividendYieldInPercent < 100
TotalDebtEquity < 50

Processing each filter…
—————————————-
Current Screen criteria: Greater NumYearPayin4Yr
Modified_df qty: 142
Current Screen criteria: Greater LeveredFreeCashFlow
Modified_df qty: 107
Current Screen criteria: Greater TRAILINGANNUALDIVIDENDYIELDINPERCENT
Modified_df qty: 30
Current Screen criteria: Less PRICEBOOK
Modified_df qty: 25
Current Screen criteria: Less TotalDebtEquity
Modified_df qty: 20
END

List of filter for the criteria: strict
—————————————-
CurrentRatio > 1.5
EPSESTIMATECURRENTYEAR > 0
DilutedEPS > 0
ReturnonAssets > 0
NumYearPayin4Yr > 2
PERATIO > 4
LeveredFreeCashFlow > 0
TRAILINGANNUALDIVIDENDYIELDINPERCENT > 2
PERATIO < 15
TotalDebtEquity < 70
PRICEBOOK < 1.5
PEGRatio < 1.2
YEARHIGH greater OPEN 0

Processing each filter…
—————————————-
Current Screen criteria: Greater CurrentRatio
Modified_df qty: 139
Current Screen criteria: Greater EPSESTIMATECURRENTYEAR
Modified_df qty: 42
Current Screen criteria: Greater DilutedEPS
Modified_df qty: 41
Current Screen criteria: Greater ReturnonAssets
Modified_df qty: 37
Current Screen criteria: Greater NumYearPayin4Yr
Modified_df qty: 32
Current Screen criteria: Greater PERATIO
Modified_df qty: 32
Current Screen criteria: Greater LeveredFreeCashFlow
Modified_df qty: 20
Current Screen criteria: Greater TRAILINGANNUALDIVIDENDYIELDINPERCENT
Modified_df qty: 15
Current Screen criteria: Less PERATIO
Modified_df qty: 8
Current Screen criteria: Less TotalDebtEquity
Modified_df qty: 7
Current Screen criteria: Less PRICEBOOK
Modified_df qty: 5
Current Screen criteria: Less PEGRatio
Modified_df qty: 5
Current Screen criteria: Compare YEARHIGH,OPEN
Modified_df qty: 5
END

 Results from “strict” criteria:

sample stock results


Storing and Retrieving Stock data from SQLite database

Getting price trends for stock analysis would require pulling of historical price data. Previous post has described various ways to pull the historical data from web. However, much time is wasted by scraping the data from web every time a trend is needed to be plotted or analyze. The more effective way is to store the data to a database (SQLite), update any new data to it and pull the respective data for analysis as needed.

Previous post have described the procedure for inputting the data to database. Here we integrate the various tools to create a database of historical prices and dividend payout. It utilizes the following to input the data to SQLite database:

  1. Getting historical stock quotes and dividend Info using python” – this uses the Yahoo API to obtain historical prices which can be more than 10 years. It can also retrieve the dividend information which calculate the dividend payout timing and amount. This is being used to set up the database with the inital data. The data retrievial is relatively slow as it can only handle one stock at a time.
  2. Get historical stock prices using Yahoo Query Language (YQL) and Python” – This is used for uploading recent data to the database given the advantage of pulling multiple stock data at single request using the YQL.

The above handles the downloading of the data to database. The transfer of downloaded data to sql database is easy with the help of pandas to_sql function again as described in the previous post. This allow easy handling of duplicated entries and addition of new data automatically.

Subsequently, to retrieve the data from database such as for “Basic Stock Technical Analysis with python“, we can make use of the SQLite command “Select * from histprice_table” to retrieve all the stock prices from the database. This is subsequently convert to Pandas Dataframe object to be used in cases where there is need for the historical data.

The following shows the sql database class. It has methods that can quickly build up database of historical price (see class method: setup_db_for_hist_prices_storage), update new data (see class method: scan_and_input_recent_prices) and retrieve the historical prices and dividend info from database (see class method: retrieve_hist_data_fr_db ). The number of data retrieved can be set using the date interval.

import re, sys, os, time, datetime, csv
import pandas
import sqlite3 as lite
from yahoo_finance_historical_data_extract import YFHistDataExtr
from Yahoo_finance_YQL_company_data import YComDataExtr #use for fast retrieval of data.

class FinanceDataStore(object):
    """ For storing and retrieving stocks data from database.

    """
    def __init__(self, db_full_path):
        """ Set the link to the database that store the information.
            Args:
                db_full_path (str): full path of the database that store all the stocks information.

        """
        self.con = lite.connect(db_full_path)
        self.cur = self.con.cursor()
        self.hist_data_tablename = 'histprice' #differnt table store in database
        self.divdnt_data_tablename = 'dividend'

        ## set the date limit of extracting.(for hist price data only)
        self.set_data_limit_datekey = '' #set the datekey so 

        ## output data
        self.hist_price_df = pandas.DataFrame()
        self.hist_div_df = pandas.DataFrame()

    def close_db(self):
        """ For closing the database. Apply to self.con
        """
        self.con.close()

    def break_list_to_sub_list(self,full_list, chunk_size = 45):
        """ Break list into smaller equal chunks specified by chunk_size.
            Args:
                full_list (list): full list of items.
            Kwargs:
                chunk_size (int): length of each chunk.
            Return
                (list): list of list.
        """
        if chunk_size < 1:
            chunk_size = 1
        return [full_list[i:i + chunk_size] for i in range(0, len(full_list), chunk_size)]

    def setup_db_for_hist_prices_storage(self, stock_sym_list):
        """ Get the price and dividend history and store them to the database for the specified stock sym list.
            The length of time depends on the date_interval specified.
            Connection to database is assuemd to be set.
            For one time large dataset (where the hist data is very large)
            Args:
                stock_sym_list (list): list of stock symbol.

        """

        ## set the class for extraction
        histdata_extr = YFHistDataExtr()
        histdata_extr.set_interval_to_retrieve(360*5)# assume for 5 years information
        histdata_extr.enable_save_raw_file = 0

        for sub_list in self.break_list_to_sub_list(stock_sym_list):
            print 'processing sub list', sub_list
            histdata_extr.set_multiple_stock_list(sub_list)
            histdata_extr.get_hist_data_of_all_target_stocks()
            histdata_extr.removed_zero_vol_fr_dataset()

            ## save to one particular funciton
            #save to sql -- hist table
            histdata_extr.processed_data_df.to_sql(self.hist_data_tablename, self.con, flavor='sqlite',
                                    schema=None, if_exists='append', index=True,
                                    index_label=None, chunksize=None, dtype=None)

            #save to sql -- div table
            histdata_extr.all_stock_div_hist_df.to_sql(self.divdnt_data_tablename, self.con, flavor='sqlite',
                                    schema=None, if_exists='append', index=True,
                                    index_label=None, chunksize=None, dtype=None)

        self.close_db()

    def scan_and_input_recent_prices(self, stock_sym_list, num_days_for_updates = 10 ):
        """ Another method to input the data to database. For shorter duration of the dates.
            Function for storing the recent prices and set it to the databse.
            Use with the YQL modules.
            Args:
                stock_sym_list (list): stock symbol list.
            Kwargs:
                num_days_for_updates: number of days to update. Cannot be set too large a date.
                                    Default 10 days.

        """

        w = YComDataExtr()
        w.set_full_stocklist_to_retrieve(stock_sym_list)
        w.set_hist_data_num_day_fr_current(num_days_for_updates)
        w.get_all_hist_data()

        ## save to one particular funciton
        #save to sql -- hist table
        w.datatype_com_data_allstock_df.to_sql(self.hist_data_tablename, self.con, flavor='sqlite',
                                schema=None, if_exists='append', index=True,
                                index_label=None, chunksize=None, dtype=None)

    def retrieve_stocklist_fr_db(self):
        """ Retrieve the stocklist from db
            Returns:
                (list): list of stock symbols.
        """
        command_str = "SELECT DISTINCT SYMBOL FROM %s "% self.hist_data_tablename
        self.cur.execute(command_str)
        rows = self.cur.fetchall()

        self.close_db()
        return [n[0].encode() for n in rows]

    def retrieve_hist_data_fr_db(self, stock_list=[], select_all =1):
        """ Retrieved a list of stocks covering the target date range for the hist data compute.
            Need convert the list to list of str
            Will cover both dividend and hist stock price
            Kwargs:
                stock_list (list): list of stock symbol (with .SI for singapore stocks) to be inputted.
                                    Will not be used if select_all is true.
                select_all (bool): Default to turn on. Will pull all the stock symbol

        """
        stock_sym_str = ''.join(['"' + n +'",' for n in stock_list])
        stock_sym_str = stock_sym_str[:-1]
        #need to get the header
        command_str = "SELECT * FROM %s where symbol in (%s)"%(self.hist_data_tablename,stock_sym_str)
        if select_all: command_str = "SELECT * FROM %s "%self.hist_data_tablename
        self.cur.execute(command_str)
        headers =  [n[0] for n in self.cur.description]

        rows = self.cur.fetchall() # return list of tuples
        self.hist_price_df = pandas.DataFrame(rows, columns = headers) #need to get the header?? how to get full data from SQL

        ## dividend data extract
        command_str = "SELECT * FROM %s where symbol in (%s)"%(self.divdnt_data_tablename,stock_sym_str)
        if select_all: command_str = "SELECT * FROM %s "%self.divdnt_data_tablename

        self.cur.execute(command_str)
        headers =  [n[0] for n in self.cur.description]

        rows = self.cur.fetchall() # return list of tuples
        self.hist_div_df = pandas.DataFrame(rows, columns = headers) #need to get the header?? how to get full data from SQL

        self.close_db()

    def add_datekey_to_hist_price_df(self):
        """ Add datekey in the form of yyyymmdd for easy comparison.

        """
        self.hist_price_df['Datekey'] = self.hist_price_df['Date'].map(lambda x: int(x.replace('-','') ))

    def extr_hist_price_by_date(self, date_interval):
        """ Limit the hist_price_df by the date interval.
            Use the datekey as comparison.
            Set to the self.hist_price_df

        """
        self.add_datekey_to_hist_price_df()
        target_datekey = self.convert_date_to_datekey(date_interval)
        self.hist_price_df = self.hist_price_df[self.hist_price_df['Datekey']>=target_datekey]

    def convert_date_to_datekey(self, offset_to_current = 0):
        """ Function mainly for the hist data where it is required to specify a date range.
            Default return current date. (offset_to_current = 0)
            Kwargs:
                offset_to_current (int): in num of days. default to zero which mean get currnet date
            Returns:
                (int): yyymmdd format

        """
        last_eff_date_list = list((datetime.date.today() - datetime.timedelta(offset_to_current)).timetuple()[0:3])

        if len(str(last_eff_date_list[1])) == 1:
            last_eff_date_list[1] = '0' + str(last_eff_date_list[1])

        if len(str(last_eff_date_list[2])) == 1:
            last_eff_date_list[2] = '0' + str(last_eff_date_list[2])

        return int(str(last_eff_date_list[0]) + last_eff_date_list[1] + str(last_eff_date_list[2]))


Get historical stock prices using Yahoo Query Language (YQL) and Python

Previous post demonstrated pulling company balanced sheets and financial records using Yahoo Query Language (YQL) . Historical prices which is used to calculate price trends can also be obtained from YQL using following table “yahoo.finance.historicaldata”. The YQL statement is as followed:

select * from yahoo.finance.historicaldata where symbol in (“stock_sym1″,”stock_sym2”) and startDate = “2009-09-11” and endDate = “2010-03-10”

Note that for this method,  multiple stocks can be retrieved at a time as highlighted in blue. This is a faster way compared to the method described in previous post using the Yahoo Finance API where only one stock’s data can be retrieved at a single run. However, the disadvantage of this method is that the time interval cannot be very large. Hence, this is for cases where there is a need to add more recent data of large quantity of stocks on a daily basis, for example, to a database.

The url generated from this query is as followed. The blue portion is the stock symbols, the orange is the start date and the green is the end date.

https://query.yahooapis.com/v1/public/yql?q=select%20*%20from%20yahoo.finance.historicaldata%20where%20symbol%20in%20(%225FH.SI%22%2C%22A31.SI%22)%20and%20startDate%20%3D%20%222015-02-19%22%20and%20endDate%20%3D%20%222015-02-24%22&format=json&diagnostics=true&env=store%3A%2F%2Fdatatables.org%2Falltableswithkeys&callback=

To retrieve the above using python, the same method can be employed as what is done previously by constructing the url and downloading the data using PATTERN module to download and processed the json information. Json data  can be easily transformed to a pandas Data frame for further processing which can also be easily inputted to sql using the Pandas to_sql function. Note that the url would need to consist of the stock symbols, the start and end date.


Getting historical financial statistics of stock using python

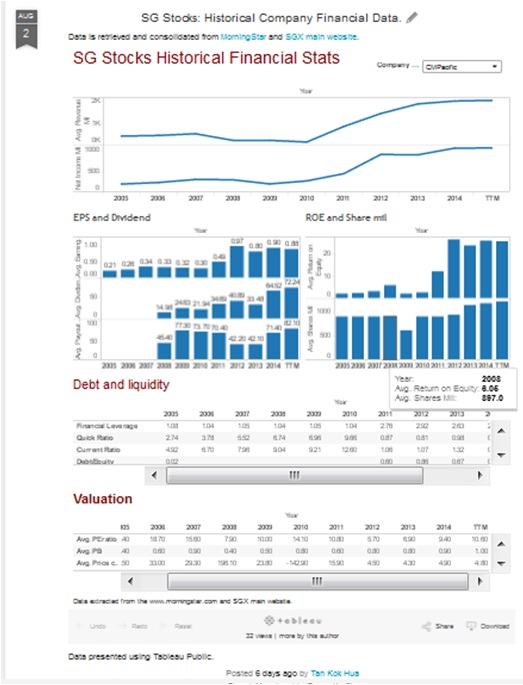
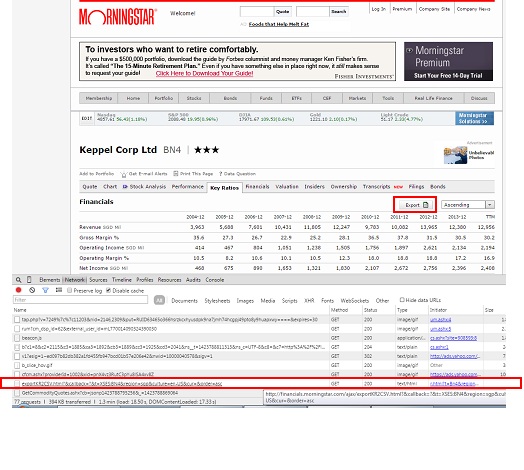
Morningstar.com provides useful information of stocks particularly financial ratio such as EPS, P/E etc breakdown to span of several years. It also provides an option for user to export all the data to a .csv file. This can be achieved by pressing the “export” button on the particular stock page. However, if there is a need to retrieve a series of stock data, users will have to visit the corresponding stock page and download the data one by one.

MorningStar

Below post is one way to retrieve the historical financial data of all target stocks. The first step will be to obtain the request url to activate the download without physically pressing the “export” button. To obtain the url, you can use the developer tools under Chrome web browser, press the network tab and monitor the ALL tab. Once the export button is pressed, the ALL tab will display the url corresponding to the request send. Example fo the url use for the request is as followed:

http://financials.morningstar.com/ajax/exportKR2CSV.html?&callback=?&t=XSES:N4E&region=sgp&culture=en-US&cur=&order=asc

The blue section is the stock symbol. By changing the stock symbol, we can use the same url to retrieve all the financial data for different stocks. The url formation will be similar to what is mentioned in previous posts and the downloading can be achieved using python pattern module. After downloading the .csv file, the data can be post processed using python pandas.

Normally, the data will be easier to process if the data can be made into a Pandas Dataframe object which will then be used for joining and transforming purpose. However, the raw data downloaded (one csv for each stock) has all the headers in the first column instead of along the rows so we would need to transpose the data set. However, once transpose, the pandas will not be able to take care of columns that are non-unique. It can handle duplicate columns easily the moment it read from a csv file so the easy way is to re-write the transpose data back to the same file and read back the data again. Once read back using the Pandas.read_csv function, the result will be a dataframe object with the duplicate columns being taken care of. The columns can be rename after that for more desired column names. Below shows the section of code that does this.

    def process_dataset(self):
        """ Processed the data set by converting the csv to dataframe and attached the information for various stocks.

        """

        ## Rows with additional headers are skipped
        try:
            self.target_stock_data_df =  pandas.read_csv(self.ms_stats_extract_temp_csv, header =2, index_col = 0, skiprows = [19,20,31,41,42,43,48,58,53,64,65,72,73,95,101,102])
        except:
            print 'problem downloading files. '
        self.target_stock_data_df = self.target_stock_data_df.transpose().reset_index()
        self.target_stock_data_df["SYMBOL"] = self.com_data_stock_portion_url
        #after transpose save back to same file and call again for column duplication problem
        self.target_stock_data_df.to_csv(self.ms_stats_extract_temp_csv_transpose, index =False)
        self.target_stock_data_df =  pandas.read_csv(self.ms_stats_extract_temp_csv_transpose)
        #rename columns
        self.target_stock_data_df.rename(columns={'Year over Year':'Revenue yoy','3-Year Average':'Revenue 3yr avg',
                                                '5-Year Average':'Revenue 5yr avg','10-Year Average':'Revenue 10yr avg',

                                                'Year over Year.1':'Operating income yoy','3-Year Average.1':'Operating income 3yr avg',
                                                '5-Year Average.1':'Operating income 5yr avg','10-Year Average.1':'Operating income 10yr avg',

                                                'Year over Year.2':'Net income yoy','3-Year Average.2':'Net income 3yr avg',
                                                '5-Year Average.2':'Net income 5yr avg','10-Year Average.2':'Net income 10yr avg',

                                                'Year over Year.3':'EPS yoy','3-Year Average.3':'EPS 3yr avg',
                                                '5-Year Average.3':'EPS 5yr avg','10-Year Average.3':'EPS 10yr avg',},
                                       inplace =True) 

        if len(self.com_data_allstock_df) == 0:
            self.com_data_allstock_df = self.target_stock_data_df
        else:
            self.com_data_allstock_df = pandas.concat([self.com_data_allstock_df,self.target_stock_data_df],ignore_index =True)
 

Once the data frame is formed, it can be used to perform various analysis such as checking if the stock have positive EPS growth over the years or the trend of P/E over the years. Below code include the get_trend function that will look at the historic EPS over time and whether it improves over time for a particular company.

import re, os, sys, math, time, datetime, shutil
import pandas
from pattern.web import URL, DOM, plaintext, extension, Element, find_urls

class MS_StatsExtract(object):
    """
        Using morning star ajax call.
        Can only get one stock at a time.
    """
    def __init__(self):
        """ List of url parameters -- for url formation """
        self.com_data_start_url = 'http://financials.morningstar.com/ajax/exportKR2CSV.html?&callback=?&t=XSES:'
        self.com_data_stock_portion_url = ''
        self.com_data_stock_portion_additional_url = ''# for adding additonal str to the stock url.
        self.com_data_end_url = '&region=sgp&culture=en-US&cur=&order=asc'
        self.com_data_full_url = ''
        self.stock_list = ''#list of stock to parse. 

        ## printing options
        self.__print_url = 0

        ## temp csv storage path
        self.ms_stats_extract_temp_csv = r'c:\data\temp\ms_stats.csv'
        self.ms_stats_extract_temp_csv_transpose = r'c:\data\temp\ms_stats_t.csv'

        ## Temp Results storage
        self.target_stock_data_df = object() 

        ## full result storage
        self.com_data_allstock_df = pandas.DataFrame()
        self.hist_company_data_trends_df = pandas.DataFrame()

    def set_stock_sym_append_str(self, append_str):
        """ Set additional append str to stock symbol when forming stock url.
            Set to sel.cur_quotes_stock_portion_additional_url.
            Mainly to set the '.SI' for singapore stocks.
            Args:
                append_str (str): additional str to append to stock symbol.
        """
        self.com_data_stock_portion_additional_url = append_str

    def set_target_stock_url(self, stock_sym):
        """ Set the target stock. Single stock again.
            Set to self.com_data_stock_portion_url
            Args:
                stock_sym (str): Stock symbol.
        """
        self.com_data_stock_portion_url = stock_sym

    def set_stocklist(self, stocklist):
        """ Set list of stocks to be retrieved.
            Args:
                stocklist (list): list of stocks to be retrieved.
        """
        self.stock_list = stocklist

    def form_url_str(self):
        """ Form the url str necessary to get the .csv file
            May need to segregate into the various types.
            Args:
                type (str): Retrieval type.
        """
        self.com_data_full_url = self.com_data_start_url + self.com_data_stock_portion_url +\
                                   self.com_data_end_url

    def get_com_data(self):
        """ Combine the cur quotes function.
            Formed the url, download the csv, put in the header. Have a dataframe object.
            Each one is one stock.
        """
        self.form_url_str()
        if self.__print_url: print self.com_data_full_url

        ## here will process the data set
        self.downloading_csv()

    def downloading_csv(self):
        """ Download the csv information for particular stock.

        """
        self.download_fault = 0

        url = URL(self.com_data_full_url)
        f = open(self.ms_stats_extract_temp_csv, 'wb') # save as test.gif
        try:
            f.write(url.download())#if have problem skip
        except:
            if self.__print_download_fault: print 'Problem with processing this data: ', self.com_data_full_url
            self.download_fault =1
        f.close()

    def process_dataset(self):
        """ Processed the data set by converting the csv to dataframe and attached the information for various stocks.

        """

        ## Rows with additional headers are skipped
        try:
            self.target_stock_data_df =  pandas.read_csv(self.ms_stats_extract_temp_csv, header =2, index_col = 0, skiprows = [19,20,31,41,42,43,48,58,53,64,65,72,73,95,101,102])
        except:
            print 'problem downloading files. '
        self.target_stock_data_df = self.target_stock_data_df.transpose().reset_index()
        self.target_stock_data_df["SYMBOL"] = self.com_data_stock_portion_url
        #after transpose save back to same file and call again for column duplication problem
        self.target_stock_data_df.to_csv(self.ms_stats_extract_temp_csv_transpose, index =False)
        self.target_stock_data_df =  pandas.read_csv(self.ms_stats_extract_temp_csv_transpose)
        #rename columns
        self.target_stock_data_df.rename(columns={'Year over Year':'Revenue yoy','3-Year Average':'Revenue 3yr avg',
                                                '5-Year Average':'Revenue 5yr avg','10-Year Average':'Revenue 10yr avg',

                                                'Year over Year.1':'Operating income yoy','3-Year Average.1':'Operating income 3yr avg',
                                                '5-Year Average.1':'Operating income 5yr avg','10-Year Average.1':'Operating income 10yr avg',

                                                'Year over Year.2':'Net income yoy','3-Year Average.2':'Net income 3yr avg',
                                                '5-Year Average.2':'Net income 5yr avg','10-Year Average.2':'Net income 10yr avg',

                                                'Year over Year.3':'EPS yoy','3-Year Average.3':'EPS 3yr avg',
                                                '5-Year Average.3':'EPS 5yr avg','10-Year Average.3':'EPS 10yr avg',},
                                       inplace =True) 

        if len(self.com_data_allstock_df) == 0:
            self.com_data_allstock_df = self.target_stock_data_df
        else:
            self.com_data_allstock_df = pandas.concat([self.com_data_allstock_df,self.target_stock_data_df],ignore_index =True) 

    def get_com_data_fr_all_stocks(self):
        """ Cater for all stocks. Each stock is parse one at a time.
        """
        self.com_data_allstock_df = pandas.DataFrame()

        for stock in self.stock_list:
            print 'Processing stock:', stock
            self.set_target_stock_url(stock)
            self.get_com_data()
            self.downloading_csv()
            self.process_dataset()

    ## process the data, group by each symbol and take the last 3-5 years EPS year on year??
    def get_trend_data(self):
        """ Use for getting trends data of the dataset.
            Separate to two separate type. One is looking at gain in yoy gain, which means the gain of EPS eg is higher this year over the last as
            compared to the EPS gain of last year over the previous one.
            The other is positive gain which look for gain of company over year.
            may have accel growth if starting is negative

        """
        grouped_symbol = self.com_data_allstock_df.groupby("SYMBOL")

        self.hist_company_data_trends_df = pandas.DataFrame()
        for label in ['EPS yoy','Revenue yoy','Net income yoy']:
            for n in range(9,5,-1):
                if n == 9:
                    prev_data = grouped_symbol.nth(n)[label]
                    accel_growth_check = (prev_data == prev_data) #for EPS growht increase every eyar
                    normal_growth_check =  (prev_data >0) #for normal increase
                    continue
                current_data = grouped_symbol.nth(n)[label]
                accel_growth_check = accel_growth_check & (current_data <= prev_data)
                normal_growth_check = normal_growth_check & (current_data >0)
                prev_data = current_data

            accel_growth_check = accel_growth_check.to_frame().rename(columns = {label: label + ' 4yr_accel'}).reset_index()
            normal_growth_check = normal_growth_check.to_frame().rename(columns = {label: label + ' 4yr_grow'}).reset_index()

            both_check_df =  pandas.merge(accel_growth_check, normal_growth_check, on = 'SYMBOL' )

            if len(self.hist_company_data_trends_df) ==0:
                self.hist_company_data_trends_df = both_check_df
            else:
                self.hist_company_data_trends_df = pandas.merge(self.hist_company_data_trends_df, both_check_df, on = 'SYMBOL' )

    def modify_stock_sym_in_df(self):
        """ Modify the stock sym in df especially for the Singapore stock where it require .SI to join in some cases.

        """
        self.hist_company_data_trends_df['SYMBOL']= self.hist_company_data_trends_df['SYMBOL'].astype(str) +'.SI'

    def strip_additional_parm_fr_stocklist(self, stocklist, add_parm = '.SI'):
        """ Strip the addtional paramters from the stock list. True in case where the input is XXX.SI and morning star do not required the additioanl SI.
            Args:
                stocklist (list): list of stock sym.
            Kwargs:
                add_parm (str): string to omit (.SI)

        """
        return [re.search('(.*)%s'%add_parm, n).group(1) for n in stocklist]

if __name__ == '__main__':

    choice  = 4

    if choice ==2:

        pp = MS_StatsExtract()
        pp.set_stocklist(['BN4','BS6','N4E','U96'])
        pp.get_com_data_fr_all_stocks()
        pp.get_trend_data()
        pp.modify_stock_sym_in_df()
        print pp.hist_company_data_trends_df

RSS feeds Reader GUI

The last post mentions about retrieving RSS feeds. To allow easy viewing, a GUI is constructed. The GUI is built using wxpython and consists of few adjustable pane with scrolling enabled. The user can choose to display the different group (eg: “World” and “SG” news) in separate panels.

For live updates, a wx.timer function is added to the GUI so the data can update every x time specified by the users. This post highlights the use of wx MultiSplitterWindow, scrollable panels and wx.timer for feeds live updates.

feeds_watcher

import os, sys, re, time
import wx
from wx.lib.splitter import MultiSplitterWindow
from General_feed_extract import FeedsReader
import  wx.lib.scrolledpanel as scrolled

class SamplePane(scrolled.ScrolledPanel):
    """
    Just a simple test window to put into the splitter.
    Set to scrollable, set to word wrap
    """
    def __init__(self, parent, label):
        scrolled.ScrolledPanel.__init__(self, parent,style = wx.BORDER_SUNKEN)
        #self.SetBackgroundColour(colour)
        self.textbox = wx.TextCtrl(self, -1, label,style=wx.TE_MULTILINE )
        vbox = wx.BoxSizer(wx.VERTICAL)
        vbox.Add(self.textbox, 1, wx.ALIGN_LEFT | wx.ALL|wx.EXPAND, 5)
        self.SetSizer(vbox)
        self.SetAutoLayout(1)
        self.SetupScrolling()

        self.SetupScrolling()
    def SetOtherLabel(self, label):
        self.textbox.SetValue(label)
        self.SetupScrolling()

class MyPanel(wx.Panel):
    def __init__(self, parent):
        wx.Panel.__init__(self, parent, -1)
        self.parent = parent

        ## Add in the feeds parameters
        self.reader = FeedsReader()

        ## Add in timer
        self.timer = wx.Timer(self)
        self.Bind(wx.EVT_TIMER, self.on_timer_update_feeds, self.timer)
        self.timer.Start(30000) # start timer after a delay, time in milli sec

        splitter = MultiSplitterWindow(self, style=wx.SP_LIVE_UPDATE)
        self.splitter = splitter
        sizer = wx.BoxSizer(wx.HORIZONTAL)
        sizer.Add(splitter, 1, wx.EXPAND)
        self.SetSizer(sizer)

        self.world_news_panel = SamplePane(splitter, "Panel One")
        splitter.AppendWindow(self.world_news_panel, 140)

        self.SG_panel = SamplePane(splitter, "Panel Two")
        #self.SG_panel.SetMinSize(self.SG_panel.GetBestSize())
        splitter.AppendWindow(self.SG_panel, 180)

        self.others_panel = SamplePane(splitter,  "Panel Three")
        splitter.AppendWindow(self.others_panel, 105)

        ## Set the orientation
        self.splitter.SetOrientation(wx.VERTICAL)

        ## Updates the panel
        self.update_panels()

    def get_feeds(self):
        """ Run the get feeds class. Use for getting updates of the feeds.

        """
        self.reader.parse_rss_sites_by_cat()

    def update_panels(self):
        """ Update all the panels with the updated feeds.
            Can use the set other label method

        """
        self.get_feeds()
        self.update_SG_panel()
        self.update_world_panel()

    def update_world_panel(self):
        """ Update World_panel on the World news.

        """
        date_key = self.reader.set_last_desired_date(0)
        if self.reader.rss_results_dict_by_cat['World'].has_key(date_key):
            World_news_list = self.reader.rss_results_dict_by_cat['World'][date_key]
            World_news_str = '\n********************\n'.join(['\n'.join(n) for n in World_news_list])
            self.world_news_panel.SetOtherLabel(World_news_str)

    def update_SG_panel(self):
        """ Update SG_panel on the Singapore stock news.

        """
        date_key = self.reader.set_last_desired_date(0)
        if self.reader.rss_results_dict_by_cat['SG'].has_key(date_key):
            SG_news_list = self.reader.rss_results_dict_by_cat['SG'][date_key]
            SG_news_str = '\n********************\n'.join(['\n'.join(n) for n in SG_news_list])
            self.SG_panel.SetOtherLabel(SG_news_str)

    def on_timer_update_feeds(self,evt):
        """ Update feeds once timer reach.
        """
        print 'Updating....'
        self.update_panels()

    def SetLiveUpdate(self, enable):
        if enable:
            self.splitter.SetWindowStyle(wx.SP_LIVE_UPDATE)
        else:
            self.splitter.SetWindowStyle(0)

class MyFrame(wx.Frame):
    def __init__(self, parent, ID, title):      

        wx.Frame.__init__(self, parent, ID, title,pos=(150, 20), size=(850, 720))#size and position

        self.top_panel = MyPanel(self)

class MyApp(wx.App):
    def __init__(self):
        wx.App.__init__(self,redirect =False)
        self.frame= MyFrame(None,wx.ID_ANY, "Feeds Watcher")
        self.SetTopWindow(self.frame)

        self.frame.Show()

def run():
    try:
        app = MyApp()
        app.MainLoop()
    except Exception,e:
        print e
        del app

if __name__== "__main__":
    run()

The following links contains information on setting up scroll bars in wx and also working with wx.timers.

  1. wx scroll bar help
  2. wx timers

Get RSS feeds using python pattern

Python Pattern allows easy way to retrieve RSS feeds. The following script will act as a feeds reader and retrieve feeds from various sites, focusing on world news and related Singapore stock market in this example.

The pattern module has the NewsFeed() function that can take in RSS url and output the corresponding results.  The following is the description of the Newsfeed object from the pattern website “The Newsfeed object is a wrapper for Mark Pilgrim’s Universal Feed Parser. Newsfeed.search() takes the URL of an RSS or Atom news feed and returns a list of Result objects.”

This will return object that has the following attributes title, link and desc. The script below takes in a dict with the different categories as key. The value are the list of RSS url belonging to that category. The script will output results in the form of dict of categories and results of each category are segregated by date key. This script allows consolidation of different feeds from various RSS sources enabling the user to further process the feeds. The printing of the feeds can be limited by the set_last_desired_date() which display only results from a certain date.

import os, re, sys, time, datetime, copy, calendar
from pattern.web import URL, extension, cache, plaintext, Newsfeed

class FeedsReader(object):
    def __init__(self):

        #For grouping to various category
        self.rss_sites_by_category_dict = {
                                            'SG':   [
                                                        'http://feeds.theedgemarkets.com/theedgemarkets/sgtopstories.rss',
                                                        'http://feeds.theedgemarkets.com/theedgemarkets/sgmarkets.rss',
                                                        'http://feeds.theedgemarkets.com/theedgemarkets/sgproperty.rss',
                                                      ],
                                            'World':[
                                                        'http://www.ft.com/rss/home/asia',
                                                        'http://rss.cnn.com/rss/money_news_economy.rss',
                                                        'http://feeds.reuters.com/reuters/businessNews',
                                                      ],
                                            }
        self.rss_sites = []

        ## num of feeds to parse_per_site
        self.num_feeds_parse_per_site = 100

        ## individual group storage of feeds.
        self.rss_results_dict = {} # dict with date as key
        self.rss_title_list = []

        ## full results set consist of category
        self.rss_results_dict_by_cat ={} # dict of dict
        self.rss_title_list_by_cat = {}  # dict of list

    def set_rss_sites(self, rss_site_urls):
        """ Set to self.rss_sites.
            Args:
                rss_site_urls (list): list of rss site url for getting feeds.
        """
        self.rss_sites = rss_site_urls

    def convert_date_str_to_date_key(self, date_str):
        """ Convert the date str given by twiiter [created_at] to date key in format YYYY-MM-DD.
            Args:
                date_str (str): date str in format given by twitter. 'Mon Sep 29 07:00:10 +0000 2014'
            Returns:
                (int): date key in format YYYYMMDD
        """
        date_list = date_str.split()

        month_dict = {v: '0'+str(k) for k,v in enumerate(calendar.month_abbr) if k <10}
        month_dict.update({v:str(k) for k,v in enumerate(calendar.month_abbr) if k >=10})

        return int(date_list[3] + month_dict[date_list[2]] + date_list[1])

    def parse_rss_sites(self):
        """ Function to parse the RSS sites.
            Results are stored in self.rss_results_dict with date as key.
        """
        self.rss_results_dict = {}
        self.rss_title_list = []

        cache.clear()

        for rss_site_url in self.rss_sites:
            print "processing: ", rss_site_url
            for result in Newsfeed().search(rss_site_url)[:self.num_feeds_parse_per_site]:
                date_key = self.convert_date_str_to_date_key(result.date)
                self.rss_title_list.append(result.title)
                if self.rss_results_dict.has_key(date_key):
                    self.rss_results_dict[date_key].append([result.title,  plaintext(result.text)])
                else:
                    self.rss_results_dict[date_key] = [[result.title,  plaintext(result.text)]]
        print 'done'

    def parse_rss_sites_by_cat(self):
        """ Iterate over the list of categories and parse the list of rss sites.
        """
        self.rss_results_dict_by_cat ={} # dict of dict
        self.rss_title_list_by_cat = {}  # dict of list

        for cat in self.rss_sites_by_category_dict:
            print 'Processing Category: ', cat
            self.set_rss_sites(self.rss_sites_by_category_dict[cat])
            self.parse_rss_sites()
            self.rss_results_dict_by_cat[cat] = self.rss_results_dict
            self.rss_title_list_by_cat[cat] = self.rss_title_list

    def set_last_desired_date(self, num_days = 0):
        """ Return the last date in which the results will be displayed.
            It is set to be the current date - num of days as set by users.
            Affect only self.print_feeds function.
            Kwargs:
                num_days (int): num of days prior to the current date.
                Setting to 0 will only retrieve the current date
            Returns:
                (int): datekey as yyyyymmdd.
        """
        last_eff_date_list = list((datetime.date.today() - datetime.timedelta(num_days)).timetuple()[0:3])

        if len(str(last_eff_date_list[1])) == 1:
            last_eff_date_list[1] = '0' + str(last_eff_date_list[1])

        return int(str(last_eff_date_list[0]) + last_eff_date_list[1] + str(last_eff_date_list[2]))

    def print_feeds(self, rss_results_dict):
        """ Print the RSS data results. Required the self.rss_results_dict.
            Args:
                rss_results_dict (dict): dict containing date as key and title, desc as value.
        """
        for n in rss_results_dict.keys():
            print 'Results of date: ', n
            dataset = rss_results_dict[n]
            if int(n) >= self.set_last_desired_date():
                print '===='*10
                for title,desc in dataset:
                    print title
                    print desc
                    print '--'*5
                    print

    def print_feeds_for_all_cat(self):
        """ Print feeds for all the category specified by the self.rss_results_dict_by_cat

        """
        for cat in self.rss_results_dict_by_cat:
            print 'Printing Category: ', cat
            self.print_feeds(self.rss_results_dict_by_cat[cat])
            print
            print "####"*18

if __name__ == '__main__':
        f = FeedsReader()
        f.parse_rss_sites_by_cat()
        print '=='*19
        f.print_feeds_for_all_cat()

The results are as followed:

Processing Category: World
processing: http://www.ft.com/rss/home/asia
processing: http://rss.cnn.com/rss/money_news_economy.rss
processing: http://feeds.reuters.com/reuters/businessNews
done
Processing Category: SG
processing: http://feeds.theedgemarkets.com/theedgemarkets/sgtopstories.rss
processing: http://feeds.theedgemarkets.com/theedgemarkets/sgmarkets.rss
processing: http://feeds.theedgemarkets.com/theedgemarkets/sgproperty.rss
done
======================================

Printing Category: World
Results of date: 20150126
Results of date: 20150127
========================================
China seeks end to gold medal fixation
‘Blind pursuit’ of success condemned as sports administrator scraps rewards for victory
———-

Tsipras poised to unveil new Greek cabinet
Athens and international creditors dig in on Greek debt
———-

EU threatens Russia with more sanctions
Call comes as violence in eastern Ukraine escalates
———-

……..

Printing Category: SG
Results of date: 20150127
========================================
Singapore shares higher; ComfortDelGro shines on broker upgrade
SINGAPORE (Jan 27): Gains in most Asian markets helped lift Singapore shares, with much of the buying centred on penny stocks.

Gainers outnumbered decliners 267 to 187, with some 1.84 billion shares worth $1.49 billion shares changin…
———-

Job vacancies in Singapore up 8.9%
SINGAPORE (Jan 27): The number of job vacancies in Singapore swelled to 67,400 in the year to September 2014, from 61,900 the previous year, with the services industry in greatest need of workers.

The bulk of the vacancies was from c…

Scraping Company info using Yahoo Query Language (YQL) and Python

Additional stock data such as company balance sheets and financial records can be scraped from yahoo finance website as described in the previous post. An alternative way which is much faster can be done using the Yahoo Query Language (YQL) . It provides collections of data  from various sources including Yahoo finance data and enable easy query of specific data sets. The results is generated in the form of json format which itself can be easily retrieved from the url link generated from the YQL query.

The YQL provides a YQL console which provides easy way for users to key in the SQL syntax to query for particular information. For example, to obtain key company statistics such as P/E ratio, cash flow etc. The following SQL can be inputted into the console.

SELECT * FROM yahoo.finance.keystats WHERE symbol in ("N4E.SI","BS6.SI")

Pressing the “Test” button will generate a url that will link to the json file containing all the information. Example of the url string is as below.

https://query.yahooapis.com/v1/public/yql?q=SELECT%20*%20FROM%20yahoo.finance.keystats%20WHERE%20symbol%20in%20(%22N4E.SI%22%2C%22BS6.SI%22)&format=json&diagnostics=true&env=store%3A%2F%2Fdatatables.org%2Falltableswithkeys&callback=

The url can now be used with the PATTERN module to download and processed the json information. For reading json file, simplejson module can be used. The url can be modified easily to include more stock symbols (the text highlighted in blue). For each url, I have included about 45 stocks symbols and loop it for all the stock symbols required. Users can also customize and filter the data using standard SQL syntax.

This method is much faster compared to the direct scraping method described previously as multiple stock symbols can be processed at one go and the json data can be easily retrieved. In contrast, direct scraping can only processed single web page (or stock) at one go and require handling of XPATH to get the data correctly.

The YQL contains 1000 of tables from different websites such as Flickr, wordpress, twitter etc and the data are easily organized in table form for easy retrieval. The url string also provides additional flexibility to query more data set.

The script for this can be easily done using standard url string formation, downloading of raw data using the Pattern module, reading the data using simplejson and converting the data to dataframe using Python Pandas.

One advantage of json file is that it is basically a dict file (of eg 45 stocks symbols) and a list of dict files can be easily transformed to a pandas Data frame for further processing. Below code abstract shows the portion in which the json file is being loaded and converted to a dict to append to a list. This list is in turn convert to Dataframe object by passing the list of dicts to the Dataframe object.

    def get_datalist_fr_json(self):
        """
            Set to self.com_data_allstock_list.
            Will keep appending without any reset.
        """
        raw_data  = json.load(open(self.saved_json_file, 'r'))
        for indivdual_set in  raw_data['query']['results']['stats']:
            temp_dict_data = {}
            if type(indivdual_set) == str:
                #for single data
                continue # temp do not use
            for parameters in indivdual_set.keys():
                if type(indivdual_set[parameters]) == str:
                    temp_dict_data[parameters] = indivdual_set[parameters]#for symbol
                elif type(indivdual_set[parameters]) == dict:
                    if indivdual_set[parameters].has_key('content'):
                        temp_dict_data[parameters] = indivdual_set[parameters]['content']

            ## append to list
            self.com_data_allstock_list.append(temp_dict_data)

    def get_com_data_fr_all_stocks(self):
        """ Cater for situation where there is large list.
            For safeguard, clip limit to 49.
        """
        full_list = self.replace_special_characters_in_list(self.full_stocklist_to_retrieve)
        chunk_of_list = self.break_list_to_sub_list(self.full_stocklist_to_retrieve)

        self.temp_full_data_df = None
        for n in chunk_of_list:
            # print the progress
            sys.stdout.write('.')

            # set the small chunk of list
            self.set_target_stocks_list(n)
            self.get_com_data()

        # convert to dataframe
        self.com_data_allstock_df = pandas.DataFrame(self.com_data_allstock_list)
        self.com_data_allstock_df.rename(columns ={'symbol':'SYMBOL'}, inplace=True)