Background
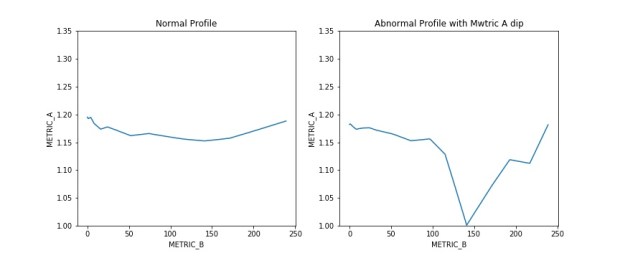
For a particular test we are handling, we need to ensure a particular metric A maintain a certain parabolic or relatively flat profile across a range of metric B. In recent days, we encountered an issue where certain samples of the population are experiencing a significant and sudden drop in metric A within a sub range of metric B.
We need to comb through the population to detect those that has the abnormal profile as shown in chart below for further failure analysis. While it is easy to identify by eye which sample are seeing abnormal performance after plotting metric B against metric A, it is impossible to scan through all the plots to identify the problem sample.
I decide to use machine learning to comb through the population to get the defective samples. Given the limited training samples on hand and the hassle of getting more data, I will use unsupervised learning for quick detection in this case.
** Note the examples below are set to be to randomly generated as model to the real data set.
Pre-processing
There are certain pre-processing done on actual data but not on the sample data. Some of the usual pre-processing tasks performed are illustrated below.
- check and remove missing data (can use pd.isnan().sum()
- drop non required columns (pd.drop())
Features Engineering
To detect the abnormal profile, I need to build the features that might be able to differentiate normal vs abnormal profile. Below are some of the features I can think of which is derived by aggregating Metric A measured across all Metric B for each sample:
- Standard deviation of Metric A
- Abnormal profile will have larger stddev due to the sharp drop.
- Range of Metric A
- larger range of max – min for the abnormal profile.
- Standard deviation of Running delta of Metric A
- Running delta is defined as the delta of Metric A for particular Metric B against Metric A of previous Metric B. A sudden dip in Metric A will be reflected in the sudden large delta.
- Standard deviation of the running delta will catch the variation in the rise and dip.
- Max of Running delta of Metric A
- This will display the largest delta within a particular sample.
Scaling and K-means Clustering
A basic scaling is done to normalize the features before applying the KMeans. All the functions will be from SkLearn. KMeans cluster is set to 2 (normal vs abnormal profile)
Results
This is a short and quick way to get some of the samples out for failure analysis but will still need further fine tuning if turn on for production modes.
Sample Script
